Richest Counties in Kansas (2025)
by Kristen Carney ![]()
Updated: December 17, 2024
Richest County in Kansas
The richest county in Kansas is Johnson County with an average household income of $142,699 as of 2023 and 622,237 people as of 2023 according to the most current Census data available (citation).
| Rank | County | Population | Average Income | Median Income |
|---|---|---|---|---|
| 1 | Johnson County | 622,237 | $142,699 | $107,261 |
| 2 | Meade County | 3,911 | $111,777 | $74,868 |
| 3 | Grant County | 7,147 | $111,074 | $72,484 |
| 4 | Sherman County | 5,844 | $107,922 | $64,444 |
| 5 | Miami County | 35,320 | $106,267 | $88,000 |
| 6 | Sheridan County | 2,423 | $105,689 | $70,000 |
| 7 | Leavenworth County | 83,518 | $104,102 | $86,906 |
| 8 | Pottawatomie County | 26,382 | $103,077 | $87,694 |
| 9 | Kiowa County | 2,374 | $101,036 | $73,214 |
| 10 | Ness County | 2,618 | $99,145 | $66,107 |
| 11 | Butler County | 68,632 | $98,834 | $80,375 |
| 12 | Nemaha County | 10,114 | $98,052 | $77,375 |
| 13 | Gray County | 5,743 | $96,744 | $77,885 |
| 14 | Thomas County | 7,865 | $96,561 | $73,575 |
| 15 | Jefferson County | 18,327 | $95,339 | $77,393 |
| 16 | Greeley County | 1,181 | $94,983 | $78,819 |
| 17 | Douglas County | 120,553 | $93,634 | $68,756 |
| 18 | Rush County | 2,830 | $93,181 | $60,288 |
| 19 | Wichita County | 2,082 | $91,654 | $71,282 |
| 20 | Sedgwick County | 528,469 | $91,563 | $67,675 |
Median Income versus Average Income: Which Should You Use?
We usually suggest using median income data – either instead of or in addition to – average income data as a true indicator of wealth. If you haven’t thought about median versus average since your last standardized test, you aren’t alone. Here’s what they are:
- average is the sum of a set of numbers divided by the count of numbers in the set
- median is the middle number in the set of numbers
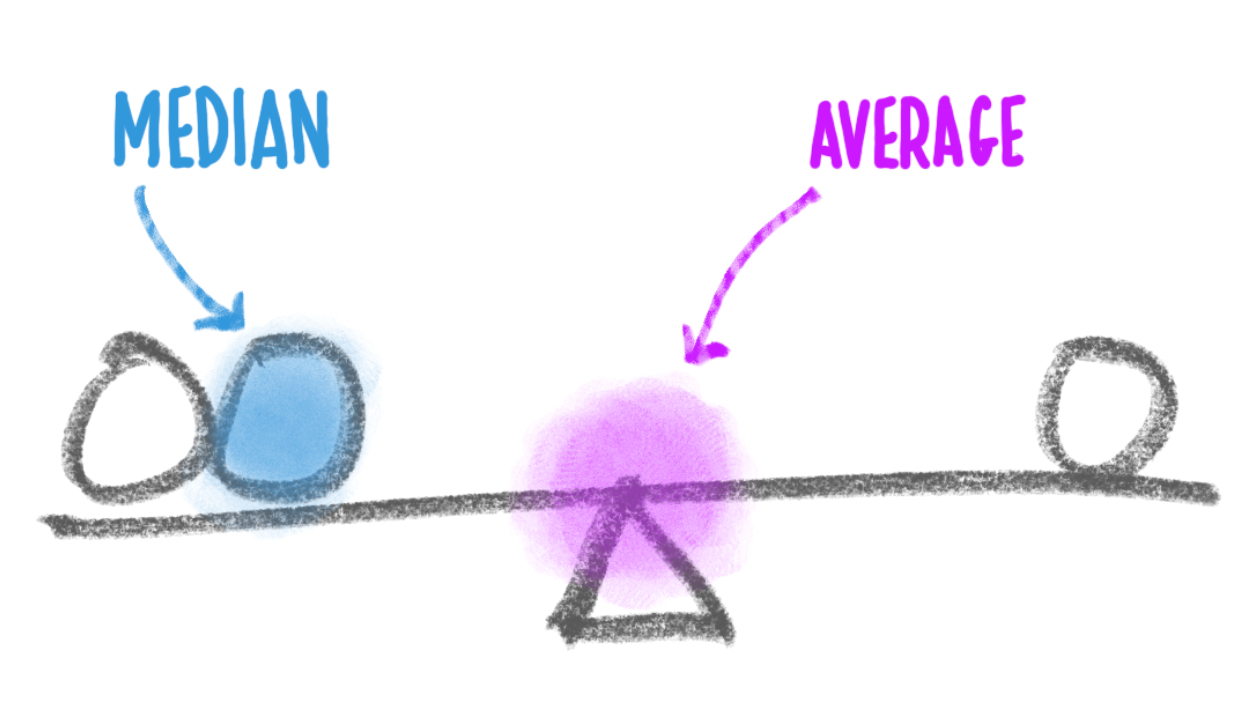
Now let’s say you had the following simplified set of income data.
Household 1: $30,000
Household 2: $50,000
Household 3: $1,000,000
The average income for this set is $360,000. The outlier data point ($1,000,000) skews the average WAY up. Conversely, the average income would be skewed WAY down if someone had an income of $500. The median income for the same data set is $50,000. Outlier data doesn’t skew the median.
Most Business Owners Should Use Median Income
So most business owners should use the median income as a true indicator of wealth, because it provides a more accurate representation of a typical income, especially in areas with significant income disparity.
When Should You Use Average Income
If your target market is high-income households, the average income may be more relevant. This is because the average income can highlight the presence of a higher concentration of wealthy individuals, which is beneficial for luxury goods and services marketing. We’re using average income on this page because using the Census’s highest reported median value of $250,001 could result in multiple ties for the richest geography.
Why do so many cities have a median value of $250,001?
The Census' American Community Survey uses $250,000+ as a jam value for median income estimates to protect privacy, ensure data consistency, and simplify reporting. A "jam value" in survey data refers to a placeholder or default value used when actual data points are unavailable, incomplete, or exceed certain thresholds. We represent this jam value as $250,001 to make it easy for you to sort.
You might also be interested in:
Email Me When New Data Are Released
Join thousands of subscribers and receive just 1 (ONE!) email a year in December when the US Census Bureau releases new income data for Kansas richest counties.
SOURCES
United States Census Bureau. Annual Estimates of the Resident Population: April 1, 2020 to July 1, 2023. U.S. Census Bureau, Population Division. Web. May 2024. http://www.census.gov/.
United States Census Bureau. B01001 SEX BY AGE, 2023 American Community Survey 5-Year Estimates. U.S. Census Bureau, American Community Survey Office. Web. 12 December 2024. http://www.census.gov/.
United States Census Bureau. B19013 Median Household Income, 2023 American Community Survey 5-Year Estimates. U.S. Census Bureau, American Community Survey Office. Web. 12 December 2024. http://www.census.gov/.
United States Census Bureau. “DP03 SELECTED ECONOMIC CHARACTERISTICS.” 2023 American Community Survey 5-Year Estimates. U.S. Census Bureau, American Community Survey Office. Web. 12 December 2024. http://www.census.gov/.
Products & Services
Plumbing
Connect
- 1-800-939-2130
- Contact Us
© Copyright 2025 Cubit Planning, Inc.